If you cannot explain it simply, you do not understand it well enough. – Albert Einstein
Every month for three successive days they purge themselves, for their health’s sake, with emetics and clysters, in the belief that all disease comes from the food a man eats. – Herodotus, The Histories, Book 2
What we put into our bodies becomes the raw materials used to create our bodies, for better or worse. Red blood cells turn over about every 3 months, bone is constantly being made and reformed by osteoblasts and osteoclasts, skin cells slough off about every twelve days, and in this process the food we eat becomes the tissues of our bodies. People seem very confused about how to eat in order to take care of their bodies the best. This is an age-old problem, as demonstrated in the Herodotus quote above. But it is also understandable considering how modern research is done and interpreted, and who is responsible for dissemination of this information to the public. One reason this confusion happens is because food research tends shows correlative rather than causative relationships. Another is because food is essential to our survival, and thus it is an important part of the economy. Being such an important part of the economy can be a liability: People more interested in money than nutrition science are involved in food research and publicity.
First let’s talk about why it can be so difficult to draw conclusions from nutrition research. A correlative relationship is one where a change in one variable is associated with a change in another, but the change in the first variable does not necessarily cause the change in the other. For example, I could say that the likelihood of a child going to the pool rises at about the same time and the same rate that the likelihood of a child eating ice cream increases. Does this mean that the increased ice cream consumption CAUSES the child to go to the pool, or vice versa? No, what is probably happening is that if it is warm outside, like in the summer, a child is both more likely to eat ice cream and go to the pool because of an unrelated third variable- temperature. The amount of variables in food research can be astronomical. There are plenty of different micronutrients, macronutrients, lifestyle choice and culture differences between people who eat different kinds of food. How then can we try to make sense out of all the data we have from research? People draw their own conclusions about the correlations described in food research- because they have to. Without interpretation, all the data points are just meaningless facts. However, interpretation requires bias. As an example, let’s talk about the Nurse’s Health Study. This is an example brought to my attention by T. Colin Campbell in the book The China Study.1 T. Colin Campbell has done nutrition research for his entire professional career, publishing over 300 papers and three books. He has held positions on national councils related to health, nutrition and disease. Before publication of the Nurse’s Health Study, previous studies had shown a link between the amount of fat a woman consumed and her risk for breast cancer. The Nurse’s Health Study is a cohort study involving 121,700 registered nurses queried on diet and lifestyle habits with measured endpoints of cancer and cardiovascular disease incidence. The data from the Nurse’s Health Study showed no relation between fat consumption and cancer risk. What Campbell noted was that, although the amount of fat in the subjects’ diets did vary, the amount of each food group consumed was the same. So the subjects would eat the same amount of meat or dairy or vegetables, but the group which consumed less fat would have chosen low-fat products in the same food group. He made the point that often the amount of fat in a person’s diet is related to the amount of animal products she consumes. Thus if the subjects of this study ate mostly the same food products but with differing fat content, then it makes sense that there was no difference in disease rates based on analysis of this single nutrient. Cornell University had a good summary of the downfalls of single nutrient analysis using this same example published in 2010: http://envirocancer.cornell.edu/FactSheet/Diet/fs27.fat.cfm .
Often, we try to use reductionist science in nutrition research, which ends up blowing up in our faces quite spectacularly. Due to the complexity of the human body and the ecosystems in which it lives, we cannot try to look at a nutrient in isolation when deciding if it is good for us or not. A better way to look at nutrition would be to look at who are the healthiest people in the world, and what are they doing? Then we can start with what works, and then think backwards to figure out why it works. An author for National Geographic, Dan Buettner, published an article and then later wrote a book about places in the world called “Blue Zones.” The areas are named blue zones because that is the color ink pen used to circle them on the map by original investigators. What the term means is that there are 5 areas in the world researchers have investigated because they have the highest concentration of people living to old age free from disease and people living past 100 years old. The people in these areas do not live in exactly the same way, but there are six characteristics which all of the societies share: strong social ties to family and friends, eating mostly fresh produce with animal products used as a condiment (2 oz several times per week at most), constant moderate physical activity, and legume consumption. I like the way that Michael Pollan says it: “Eat food, not too much, mostly plants.” When he says “eat food,” it means food from your local farmer, not stuff out of a package. An apple vs. an apple pie, a home cooked meal vs. a frozen one. My health advice boils down to Michael Pollan’s advice, plus a healthy amount of physical activity and community engagement… mainly because it already works, so why re-invent the wheel with a diet of the moment.

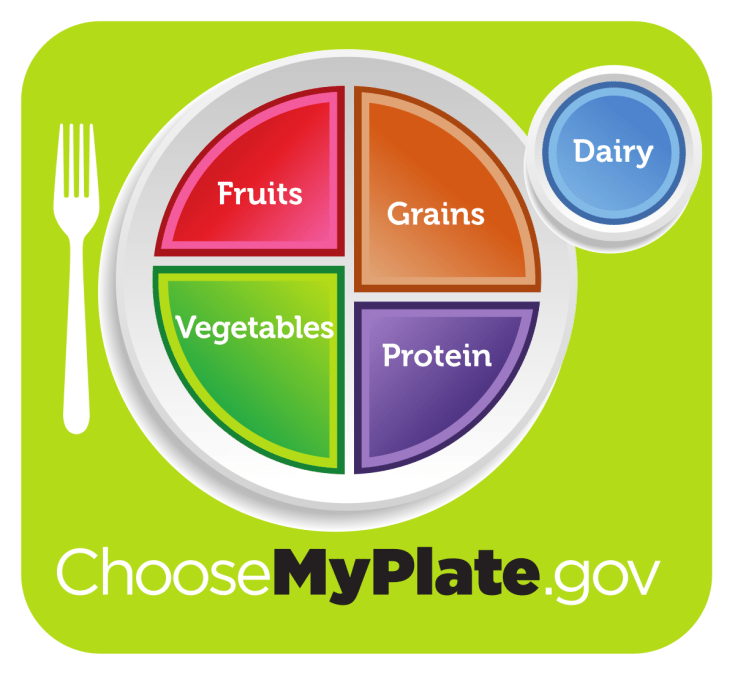
The other thing to keep in mind is that most major health organizations that concern themselves with food (The American Heart Association, The USDA Center for food and nutrition) have the same dietary recommendations, and thankfully it mimics the typical Blue Zones Diet advice above. This is the Food Plate, an educational tool the USDA uses as a visual to help with ideal diet:
- Campbell, T. Colin. The China Study: The Most Comprehensive Study of Nurtrition Ever Conducted and the Starling Implications for Diet, Weight Loss and Long-term Health. Dallas, TX.: Banbella, 2006. Print.
- Buettner, Dan. The Blue Zones Solution: Eating and Living like the World’s Healthiest People. National Geographic Society, Washington DC. Print.

Leave a comment